J.2 Performance Statistics via the WMI Interface
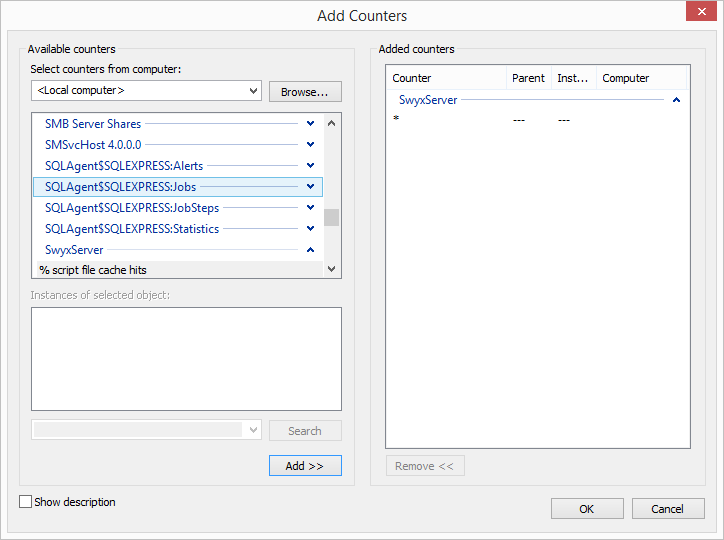
Swyx provides so-called performance counters via the Windows Management Instrumentation (WMI) interface. Currently, the following counters are available:
SwyxServer
 "Active Calls""Active External Calls""Active Internal Calls""Calls""Logged-in users""SwyxIt! Classic""Conference Devices""SwyxPhones""H323 devices""SIP devices""Running Scripts""Executed Scripts""Scrip load time""% script file cache hits""% script file cache misses""Script file cache size""Gateway trunks""Link trunks""Trunks""Client devices""Workitem queue length""Number of subscriptions""Rejected registrations""Rejected subscribtions""Rejected calls""Licenced users""Licenced channels""PBX config objects""PBX config user objects""PBX config status objects""Script devices""PBX script objects""PBX script user objects""PBX script call objects"
Swyx Trunk
"Active Trunk Calls""Trunk Calls""% Channels used""Trunk registered at server""Active Trunk Calls Inbound""Active Trunk Calls Outbound"Swyx Location
"Inter Location Call Limit""Inter Location Calls"Swyx Diagnostics
"Objects"These counters can also be read via SNMP READ (J SNMP READ ).
How to query performance counters